Trading Simulator
A full practice desk for paper trading: fake money, real mechanics. You start with a $25,000 practice account by default (presets run $5,000 to $100,000, or type your own), six order types, a three-pane chart with drawing tools, Market Replay to relive recent sessions, and a realism model that never turns off: real spread, volume-scaled slippage, fees, and honest margin math. Every close auto-logs to your journal when you're signed in.
The Simulator is a flight simulator for trading. You place real orders, against real prices, with real consequences for your account balance - except the money is fake, so every lesson is free. The formal name for this is paper trading: each buy and sell is matched against the live market (or a replay of it), but it books to a practice account instead of a brokerage account. Nothing here can cost you a dollar. That's the point. This is where you're supposed to discover that shorting that $2 stock at 3:47pm felt obvious and wasn't.


The whole desk is free and one keystroke away: ⌘6, or SIMULATOR in the sidebar. Pro and Terminal add instruments around the desk - Level 2 viewing, bracket orders, walk-book fills, CSV export - but the simulator itself, its six standard order types, replay, and hotkeys cost nothing. The tier table has the exact split.
If you're brand new: Getting started covers the account basics, and the Scanner guide covers how to find something worth practicing on. This guide assumes zero trading experience and explains every term inline.
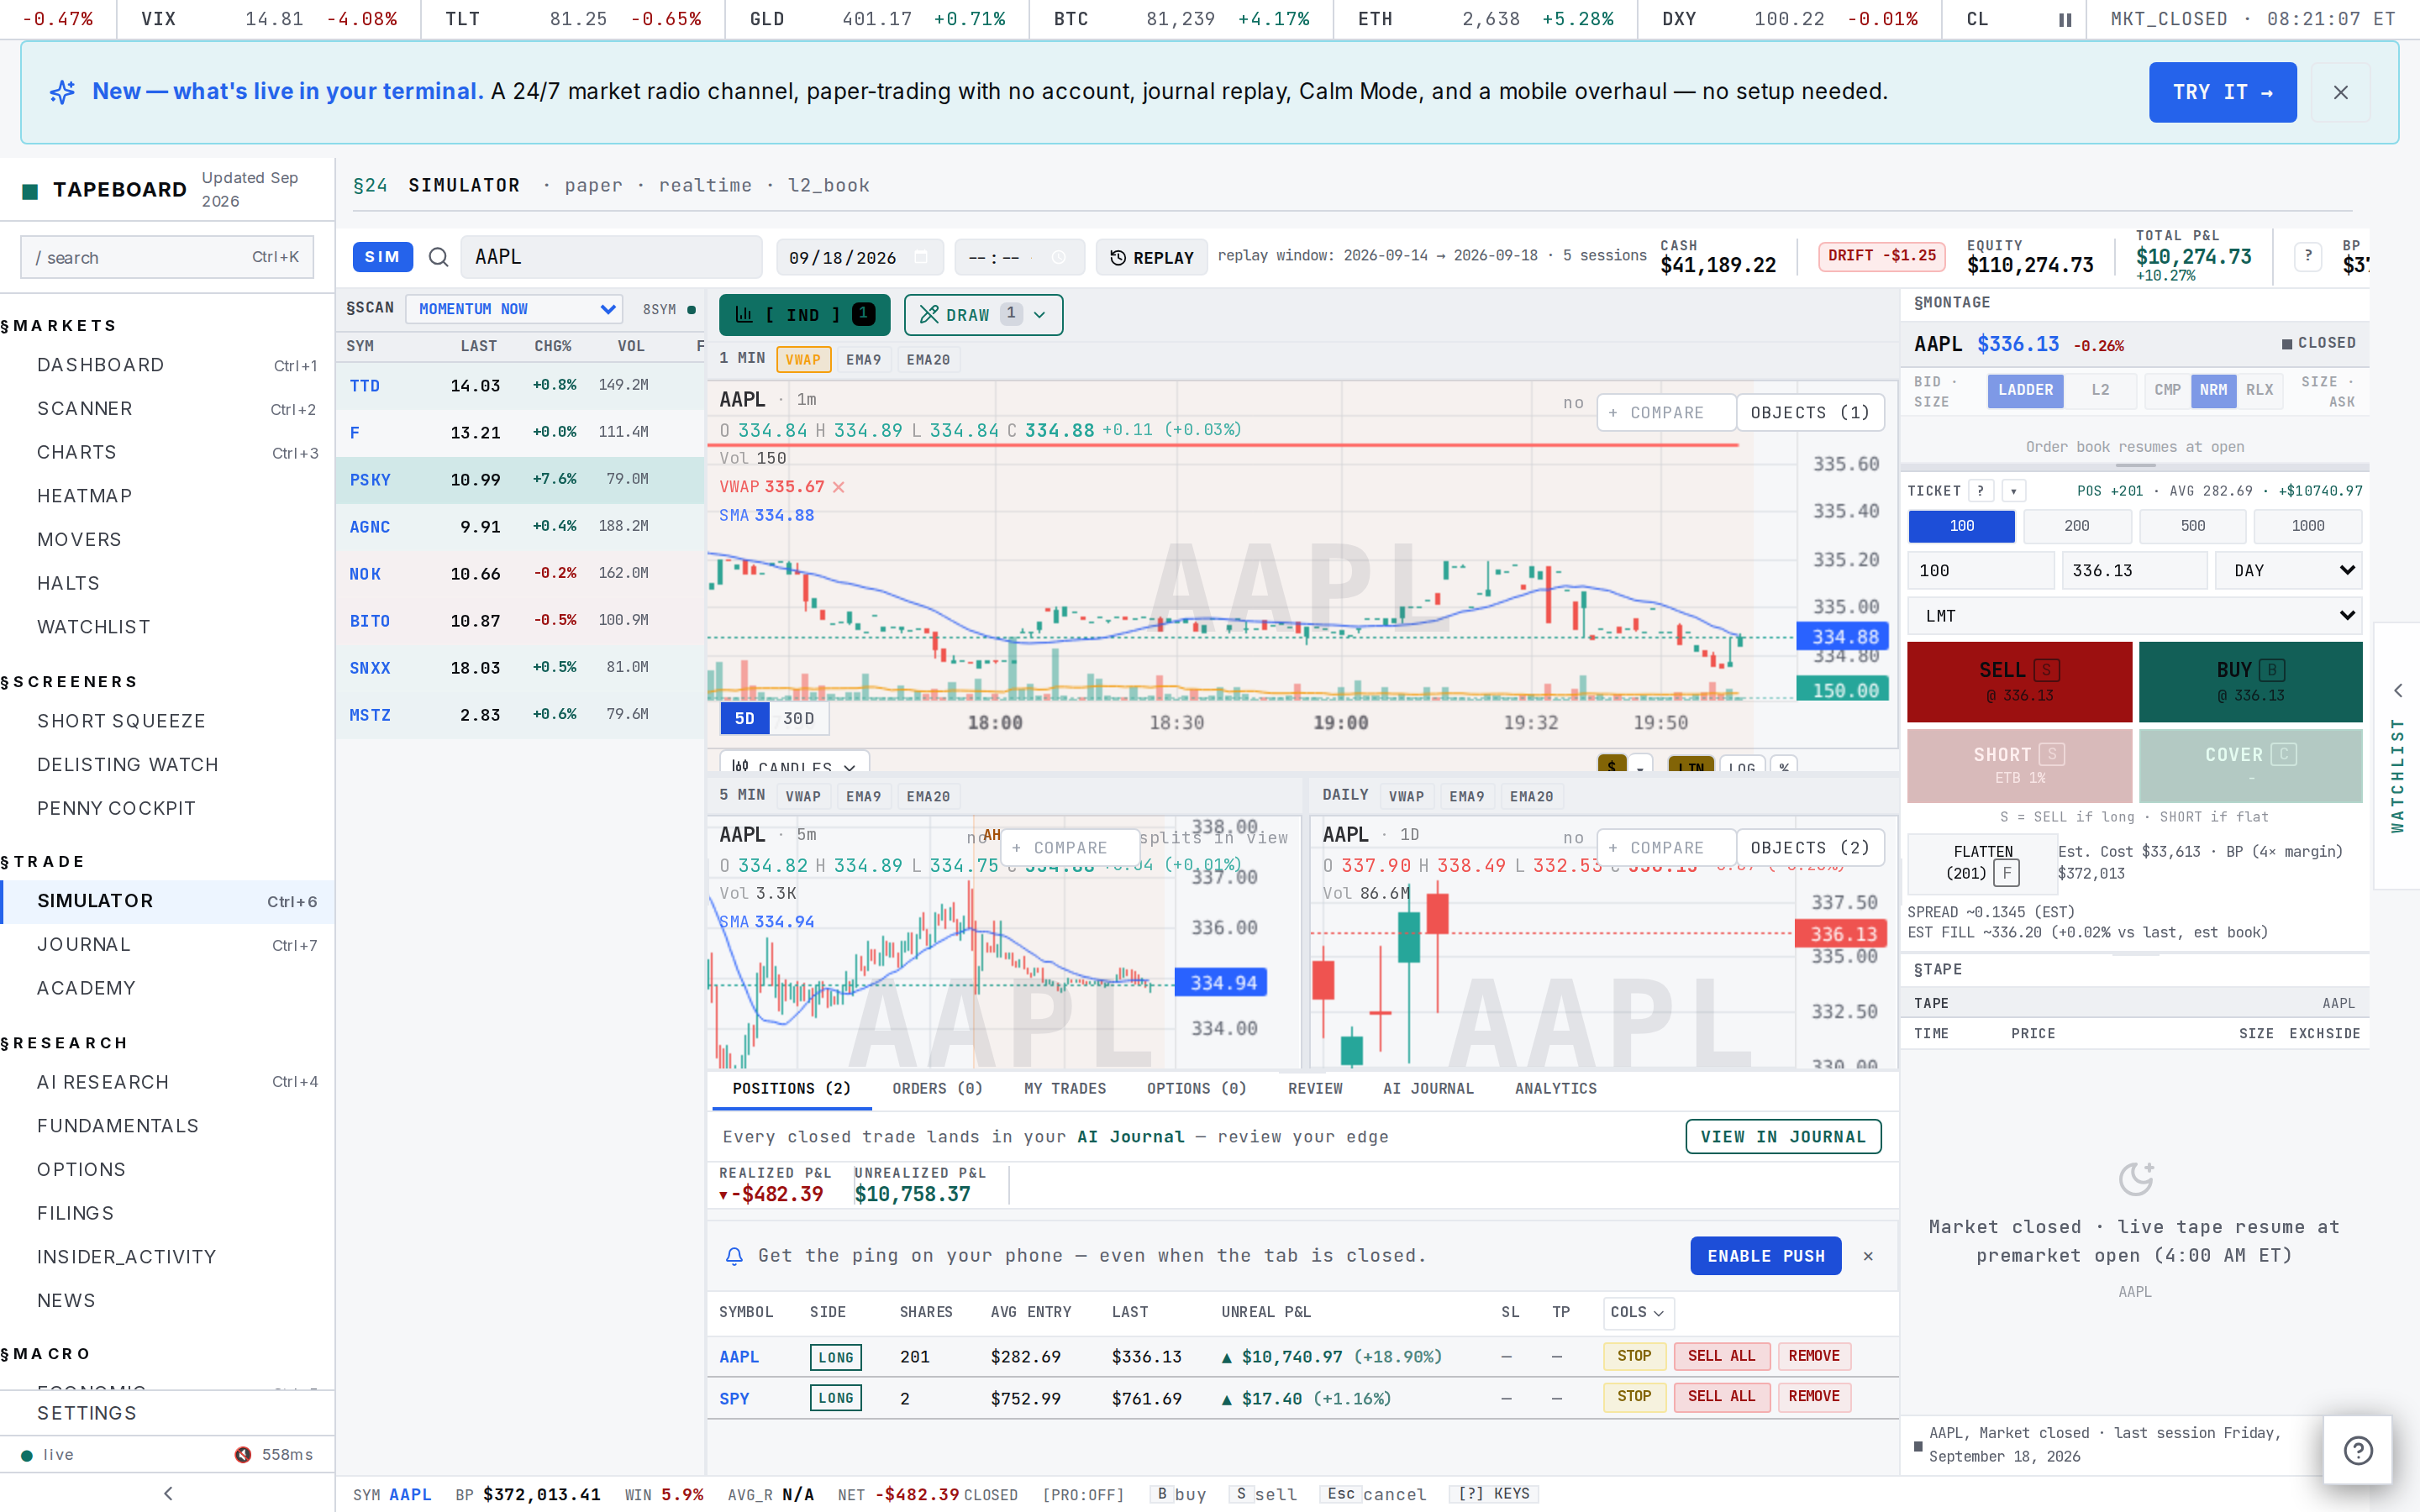
Your first three minutes
- Open the Simulator (
⌘6, or /simulator). Your very first visit opens a small modal: Set your starting balance.

- Pick your starting balance. Presets run $5,000 / $10,000 / $25,000 / $50,000 / $100,000, or type any number you want. $25,000 is the default. The modal's own advice is the right advice: *pick something realistic to your actual account size* - if you'd fund $5k, practice with $5k, so the position sizes you rehearse are the ones you'd actually place.
The same picker lives behind the RESET button in the top bar whenever you want a fresh start. RESET clears positions, orders, and history - your chart drawings and alerts survive it.
- Click Start Trading. You land on the desk with that balance loaded. The top bar tracks BP Avail (buying power) plus your session stats as you trade; on a phone, the ACCT chip opens the full account sheet.
- Load a ticker. Click the Ticker... box at the top of the page, type a symbol (say
AAPL), and press Enter. The chart, order book, and ticket all switch to it. Or bring one over from the scanner with one click.
- Place a trade. In the order ticket on the right: quantity 100 (tap a quick-size chip), order type
MKT, then BUY. A toast confirms the fill price, the account chip flashes green, and a position row appears in the Positions blotter below.
- Close it. Hover the position row and hit SELL ALL (or press
F). The trade books to history with its P&L net of fees, and - signed in - into your journal too.
That's the whole loop: find it, trade it, review it, repeat tomorrow. Everything below is that loop with the training wheels explained.
Want it walked for you once? ?tour=first-trade on the URL (or the practice-position step in the new-account onboarding) launches a five-step guided first trade - PICK A SYMBOL → SET SHARES → PLACE THE BUY → SEE YOUR P&L → IT AUTO-LOGGED - with a coach-mark pointing at each control before you touch it. Run it once and the desk stops being a wall of panels.
Placing a trade
The order ticket is the vertical panel on the right, under the Level 2 ladder. A trade is four choices: which stock, which direction, how big, and which order type.


- Load the symbol (the ticket follows whatever the chart shows). Type in the Ticker... box, click a scanner row's paper-trade button, or click a price in the Level 2 ladder itself - clicking an ask line arms the ticket to buy at that price, clicking a bid line arms it to sell there.
- Pick a side. Four buttons, and they pair off:
- BUY opens a *long* position (you own shares and profit if the price rises). SELL closes it.
- SHORT opens a *short* position (you profit if the price falls - explained below in plain words). COVER closes it.
- Set the size. Type a quantity or tap a chip (100 / 200 / 500 / 1000). The ticket shows the estimated dollar cost as you type.
- Pick the order type. The ticket's ORDER TYPE dropdown lists
MKT,LMT(limit),STOP MKT,STOP LMT, andTRAIL- each one shows a one-line explanation of what it does the moment you pick it. (The mobile ticket showsMKT/LMTpills with a chevron for the rest.) Brackets - an entry with an attached stop and target, one cancels the other - are a Pro feature: on Free, the BRACKET button on the sim chart and the ticket's BRACKET (SL/TP) toggle show a PRO lock (see the table below). - Check the price you'll get. The action buttons quote the live ask or bid they'd fill at right now -
BUY @ Ask 336.13- and on a live market the ticket adds anest. fillline with the modeled slippage for your size: a fat order into a thin stock sees a worse price, exactly like real life. - Fire. BUY, SELL, SHORT, or COVER. A fill lands as a toast and a blotter row. A problem lands as a plain-English rejection: the desk tells you *why* -
Insufficient buying power: order needs ~$3,000 but only $1,200 available (cash account)- instead of just failing silently.
The eight order types, in plain words
The first six are placeable on every tier. The last two - BRACKET and OCO - are Pro (the 7-day Pro trial includes them).
| Type | What it does |
|---|---|
MKT (market) | Fill me now, at whatever the market offers. Fastest, but you accept the spread. |
LIMIT | Fill me at this price or better. If you bid $10.00 on a stock trading $10.02, your order waits until someone sells down to you. Free on every tier. |
STOP | A safety net under a long position (or over a short): when price touches your stop number, it becomes a market order. If price *gaps* past it - jumps from $10.05 to $9.50 overnight - the fill lands at $9.50, exactly like real life. |
STOP-LIMIT | Like STOP, but instead of a market order it places your limit order when the stop fires. You choose the trigger price and the limit price. |
TRAILING STOP | A stop that follows the price up (for a long) at a fixed dollar distance. Stock rises, your stop rises with it; the moment price reverses by your offset, the stop fires and locks in the move. |
TAKE-PROFIT | The mirror of STOP: an order that closes your winner at a target price you pick. |
BRACKET *(Pro)* | Entry plus an attached stop *and* target, placed in one shot. One fires, the other auto-cancels - you can't forget the safety net on a winner. On Free the control shows a PRO lock. |
OCO *(Pro)* | "One cancels the other": two exit orders paired so the first to fill kills the other. BRACKET is a prepackaged OCO, and it comes with Pro. |
Attach protective exits from the blotter too: the STOP and TP buttons on any position row set a real protective stop-loss or take-profit on it without rebuilding an order by hand.
If the desk says no
Rejections are deliberately chatty - every one names the reason:
Insufficient buying power- the order's dollar cost exceeds what your account can spend. Buying power is cash on a cash account; on margin it's your equity times leverage (see the realism model).- Shorting on a cash account - shorts need a margin account (Settings gear, top bar).
- Halted symbol - trading is paused on that stock by the exchange; orders wait for the resume.
- Thin stock clamped - a sub-$1 or barely-traded name won't accept a monster size in one piece; the desk clamps the fill to something the stock could realistically absorb and stamps a notice on the order. Real fills partial too.
Going short (selling a stock you don't own)
Shorting confuses everyone at first, so here it is with no jargon: SHORT sells borrowed shares first, and COVER buys them back later. If you sell borrowed shares at $10 and the stock falls to $8, you buy them back for $8 and keep the $2 difference. If it rises to $12, you buy back at $12 and eat the $2 loss. Mechanically the buttons just work - SHORT opens, COVER closes - but three things about shorts are worth internalizing before you practice them:
- Your profit is capped, your loss isn't. A stock can only fall to zero; it can rise forever. Size shorts like you mean it.
- You're paying rent. Real brokers charge a daily borrow fee on shares you're short, and the simulator does too - it accrues daily on your short position at a realistic rate, so a short that sits for weeks bleeds carry exactly like the real thing.
- COVER ALL closes the whole position in the Positions tab, same as SELL ALL does for a long.
The realism model handles the rest: margin requirement, the borrow fee accrual, and rejection if you lack the margin to open the short.
The blotter tabs
The panel along the bottom is your blotter - trading jargon for "the list of everything you've done." Seven tabs:
- Positions - everything you currently hold: side (LONG/SHORT), shares, average entry, current mark, unrealized P&L, and risk columns. Row actions: STOP places a real protective stop-loss, SELL ALL / COVER ALL flatten the position in one tap, and a quiet REMOVE deletes a stuck row without booking a P&L - last-resort housekeeping, not a trade. Optional columns add R (your planned risk basis, for R-multiple tracking) and TP (your take-profit target).

A short position reads the same but with the SHORT side chip, a negative-P&L flip, and COVER ALL as the flatten button:

- Orders - every working (resting) order that hasn't filled yet: pending, queued, partial. Click an unfilled one to edit it inline.
- My Trades - your execution ledger: every fill and cancel, filterable. The tape of record for "what did I actually do."
- Options - paper calls and puts with strike, expiry, and greeks (the sensitivity numbers options traders quote at each other). Options share your equity cash balance. Sell-to-close or buy-to-close to exit; contracts expire on schedule.
- Review - the coaching engine. After you close a trade, tag what the setup was (breakout, VWAP reclaim, gap-and-go...) and write a note. The tab then groups your results BY TAG: win rate, average R, net P&L per setup, and the R-multiple distribution histogram. After a couple dozen trades this tab knows your game better than your gut does - the tags tell you which setups you should be doubling down on.
- AI Journal - the journal-writing panel, drawing from the same closes. The AI write-up is Pro (the 7-day trial grants it); the raw trade log itself is free.
- Analytics - your scorecard: total P&L, win rate, profit factor, expectancy, Sharpe and Sortino (risk-adjusted return, with Sortino only punishing downside swings), max drawdown (your worst peak-to-valley dip), average hold time, win/loss ratio, largest win - over an equity curve, broken out per symbol.
Shift+Ablows it up fullscreen. CSV export of your history is a Terminal feature.

The chart, and drawing on it
The center column is the same engine as the Charts page, in the sim's own three-pane layout: 1 MIN on top (the primary pane - during a live session this is your scalper's chart), 5 MIN and DAILY underneath. Drag the hairlines between panes to resize them. Each pane carries a VWAP overlay - volume-weighted average price, the day's average price weighted by how many shares traded at each level - which day traders treat as the line in the sand between a strong and a weak stock.

Drawings live on the 1 MIN pane and survive everything except you deleting them - session end, even an account RESET keeps them. The chart toolbar's DRAW button opens the drawing palette: 23 tools in all; the five that matter when you're starting:
| Tool | What it's for |
|---|---|
TREND (trendline) | Click two points - lows of an uptrend, highs of a downtrend - to see whether a move is holding its slope. The beginner's first tool. |
HLINE (horizontal line) | One click marks a price level that mattered - yesterday's high, the open price, a round number. |
FIB (Fibonacci retracement) | Click a swing high, then a swing low; the tool draws the retracement levels between them. Traders watch the 38.2% / 50% / 61.8% lines for pullbacks to reverse. |
RECT (rectangle) | Two clicks outline a zone - consolidation, a base, support. |
MEASURE | Drag from point A to B to get the distance in price, percent, and bars. |
The rest - channels, pitchforks, position simulators, another half-dozen Fibonacci variants - are in the palette when a pattern demands one. CLEAR wipes the pane; drawings also carry over into Market Replay, because replaying a past day's chart on top of your old lines is half the point of keeping them.
Closing out, and where your trades go
A trade isn't a trade until it's closed. F flattens the selected symbol, SELL ALL / COVER ALL flatten it from the blotter, and Shift+F flattens *everything* when the day is done. Each close records:
- Entry and exit prices, sizes, and timestamps
- P&L net of fees - the number that's honest, after commissions (if you've set any), the spread you crossed, and the SEC/FINRA fees on sells
- Hold time - seconds, minutes, or days
- R-multiple, when you set a stop: profit expressed as a multiple of what you risked. Risked $50 to make $100? That's +2R. R is the unit professional traders grade in, because it makes a $200 scalp on a $2k account comparable to a $2,000 win on a $25k one.
Close a trade while signed in and it auto-logs to the Trading Journal, deduplicated (the same close can't log twice) and free to write - the journal *displays* the latest 20 on the free tier, Pro lifts that. Anonymous practice sessions don't sync anywhere: sign in if you want the history. That's the practice loop the simulator exists for - trade it, close it, review it in Review or the journal, and let the data change your next session.
Done for the day? END SESSION (top bar) wraps the session and shows a summary card. Come back tomorrow and do it again - that repetition is the whole edge.
Coming from the scanner
The scanner finds the candidates; the simulator rehearses them. Every handoff below opens the simulator with that symbol already loaded in the chart, book, and ticket - no retyping:
- The paper-trade button on a scanner row (desktop and mobile)
- PAPER TRADE in the scanner's right-side drawer
- The right-click row menu's Open in Sim
- The SIMULATOR shortcut at the right end of the scanner toolbar
The handoff also carries context: your ticket comes pre-tagged with the setup that motivated the trade (like scanner_mover), which flows into the Review tab's per-tag stats later. On mobile, a handoff drops you straight into the TRADE view with the ticket ready.
This pairing is the core of how the whole site is meant to be used - the scanner's guide calls it the core loop: hunt it, look at it, save it, practice it. The simulator is the last step of that loop, and the only one where being wrong is free.
Practice the days that mattered: Market Replay
Live markets only let you watch once, in real time, at the speed of the market. REPLAY (top bar) fixes that: pick a symbol + a past trading day (and an optional start time - say 09:35 to start five minutes after the open), and the simulator rebuilds that session's 1-minute tape and lets you drive it.
- Play / pause / step - move one minute bar at a time, or let it run
- Speed - up to max speed, faster than it happened
- Scrub - drag the slider to jump around the session
Crucially, orders run through the exact same fill engine in replay as live - same spread, slippage, stops, and P&L math. You trade the day; you don't watch it. Replay covers roughly the last five trading days only - that's the 1-minute data window the desk draws from, so anything older simply isn't offered. The replayable-day picker only offers sessions that exist, so you can't request a day and get a blank chart.
On mobile, the same controls live in a collapsible replay strip just above the bottom navigation - day picker, play/pause, speed, scrub, and an exit, with an oversized thumb target.


Beginner superpower section, not a gimmick: the classic exercise is replaying a big gap-up day bar by bar, pausing right after the open spike, and deciding - before pressing play - long, short, or nothing. Then watch what the day did and grade your read. One session of that teaches more than a week of passive chart-staring.
The realism model (always on)
Every fill passes through a realism model you can tune but never turn off. Practice results only transfer to real trading if practice *feels* like real trading, so:
- You cross the real bid/ask. A buy fills at the ask, a sell at the bid - the spread between them is a real cost you pay, just like at a real broker. (The free tier gets no Level 2 data stream, so the desk models a synthetic half-spread around the last trade and stamps that basis on the order row - honest about being modeled. Executing against real book depth is the Terminal execution feature.)
- Size pays for being size. Slippage scales with your order's size relative to the stock's recent volume - a 10,000-share market order into a thin mover fills worse than 100 shares, on the same tick.
- Fees are real. Sells pay the SEC section 31 fee and FINRA's trading activity fee - cents, but real. Commissions default to zero (retail equities are commission-free in 2026); the gear menu lets you set per-share or per-trade commissions if your real broker charges them.
- Margin math is honest. A cash account buys with cash, 1×, and can't short. A margin account with at least $2,000 equity gets 2× overnight and 4× intraday buying power, plus the daily borrow fee on shorts. Margin-loan interest on borrowed funds isn't modeled in the current simulator; the borrow fee on shorts is the only carry charge. The FINRA $2,000 minimum is the real rule.
- The old PDT rule is off by default. The pattern-day-trader rule (a $25,000 minimum to day-trade margin accounts, killed by FINRA rule changes effective 2026-06-04) is gone from the default settings - the gear menu keeps a toggle for it if you want to simulate the old regime.
The full fill math - spread, slippage curves, fee lines - is published at /methodology/sim-fills. The gear menu (Settings, top bar) holds every knob: cash vs margin, commissions, the fee toggle, the PDT toggle, and small extras like spoken order audio (a voice reads your fills back to you).

Hotkeys
Hands-off-the-mouse trading is the scalper's endgame, and the sim ships with the bindings ready. They're ignored while you're typing in a text field, and ? (Shift+/) opens the in-app cheat sheet from anywhere on the sim:
| Key | Action |
|---|---|
B | Buy at market |
S | Sell at market - or open a short if you're flat (smart-routed) |
C | Cover at market |
F | Flatten the selected symbol (close the whole position) |
Shift+F | Flatten *everything* - close every position on the account |
Esc or Shift+C | Cancel all working orders |
+ / - | Step the order size up / down |
[ | Scale out - sell half the position |
] | Scale in - buy half again |
? | Open the hotkey cheat sheet |
Every binding is remappable in Settings → Preferences → Hotkeys, and the keyboard shortcuts guide has the rest of the app.
Tiering summary
| Capability | Free | Pro ($39/mo) | Terminal ($79/mo) |
|---|---|---|---|
| The simulator desk, all six core order types, hotkeys, Market Replay | Yes | Yes | Yes |
| Practice account ($25k default, $5k-$100k presets) | Yes | Yes | Yes |
| Chart + drawing tools, Analytics tab | Yes | Yes | Yes |
| Closes auto-log to the journal | Yes (journal displays latest 20) | Yes (unlimited) | Yes (unlimited) |
| Bracket orders (stop + target, one cancels the other) | - | Yes | Yes |
| Level 2 book + time & sales (viewing) | - | Yes | Yes |
| Journal AI write-ups | - | Yes | Yes |
| Fills walk the real Level 2 book | - (synthetic-spread model) | - | Yes |
| History CSV export | - | - | Yes |
Every new account gets a 7-day Pro trial, no card, so the Pro column is yours to try the first week. Terminal's walk-book fills are the closest paper gets to real execution: your order walks the actual depth ladder level by level, exactly as a real order would.
Troubleshooting
Why was my order rejected? The rejection names the reason. Most common: not enough buying power (the message shows what the order needs vs what you have), shorting on a cash account (switch to margin in the Settings gear), or a halted symbol.
Is any of this real money? No. The simulator is paper trading - fake money, real mechanics. No card, no billing, no broker. It exists so your mistakes cost nothing.
Where do I see my cash, buying power, and margin numbers? Desktop shows BP Avail in the top bar; on mobile the ACCT chip opens the account sheet - cash, equity, buying power, and your day-trade status.
My fill price wasn't the last price I saw on the chart. Correct, and that's deliberate. You buy at the ask and sell at the bid (the spread), and size pays slippage. The estimate line in the ticket shows the expected fill before you commit. See the realism model.
My market order filled in two pieces. Thin or cheap stocks won't absorb big size in one gulp - the fill clamps to what the stock realistically trades, and the rest follows. The order row stamps the notice.
My limit order is just sitting there. It's waiting for the market to reach your price - that's what a limit does. Check the Orders blotter tab for its status (pending / queued / partial); click it there to edit or cancel.
Do anonymous sessions sync anywhere? No - practice history on a logged-out session stays in that browser. Sign in and every close auto-logs to the journal, deduplicated, for free.
Does replay work on mobile? Yes - the replay strip above the bottom nav carries the day picker, play/pause, speed, and scrub.
My Positions row is stuck and SELL ALL didn't clear it. SELL ALL books a market close - if that itself can't fill (halted stock), the row stays with the reason visible. The quiet REMOVE button on the row is the last resort: deletes the position without a market close and books no P&L.
I want a fresh start. RESET (top bar) clears positions, orders, and history and re-offers the starting-balance presets. Chart drawings and alerts survive the reset - only the account state resets.
Related
Every guide below pairs with a one-click surface - guide for the *how*, link for the *doing*:
- Simulator → /simulator (this page)
- Scanner → /scanner (Scanner guide) - find what to practice on
- Charts → /charts (Charts guide) - the same engine in full
- Trading Journal → /journal (Journal guide) - where your closes land
- Keyboard Shortcuts · Getting started · All guides
- Pricing → /pricing (Pricing guide) · Fill methodology