What we built in September 2026
September on Tapeboard: a new chart across the terminal, alerts you set on the chart that follow you to the Alerts tab, live futures, a filing viewer with Ask AI, a scanner you can talk to, and a rebuilt notification bell. What changed, how to use it, and where to click.
September changed how the terminal looks at a price. The chart is new, the alerts you draw on it reach your phone, filings open next to the scanner with an AI you can question, and the scanner understands plain English. Every section below has a link that opens the feature in the app, so you can try it while you read.
The new chart
The benefit: you can see where the session changed. Pre-market and after-hours bars are shaded, earnings, dividend and split markers sit on the bars where they happened, and a bolt marks the candles where news hit.


The same chart now runs on the Charts page, in the scanner panels, on research pages, in the penny cockpit, on Commodities and on Forex. Pro adds 10, 15 and 30 second timeframes. The pattern detector sits behind the PATTERNS button and outlines formations like head and shoulders so you can check them by eye. Layouts with several panes let you drag a pane to reorder it, and link colors keep panes on the same symbol, and the same timeframe if you want.
How to use it: open a symbol, press 1, 5 or D to change timeframe, then switch EVENTS and NEWS on from the toolbar. Drag a pane by its title to move it.
Open the chart → · Read the Charts guide
Indicators that stay put
The benefit: you build the setup once. Each timeframe keeps its own set of indicators, and the set follows you to the next symbol.
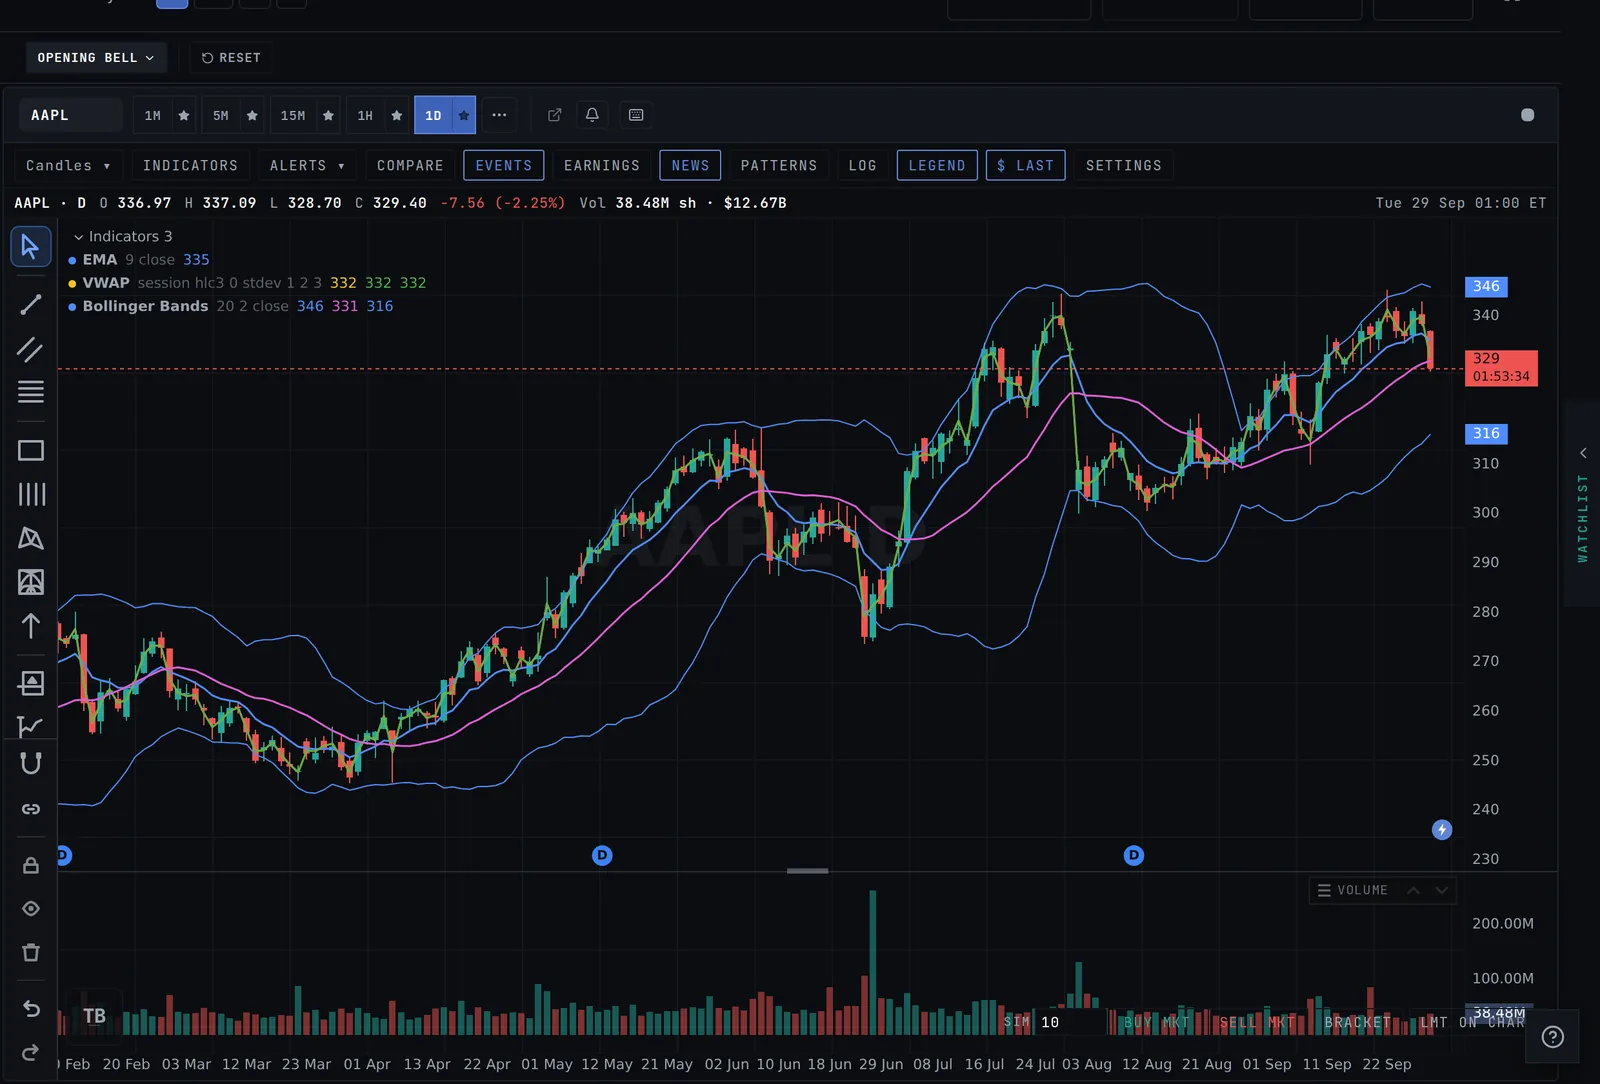
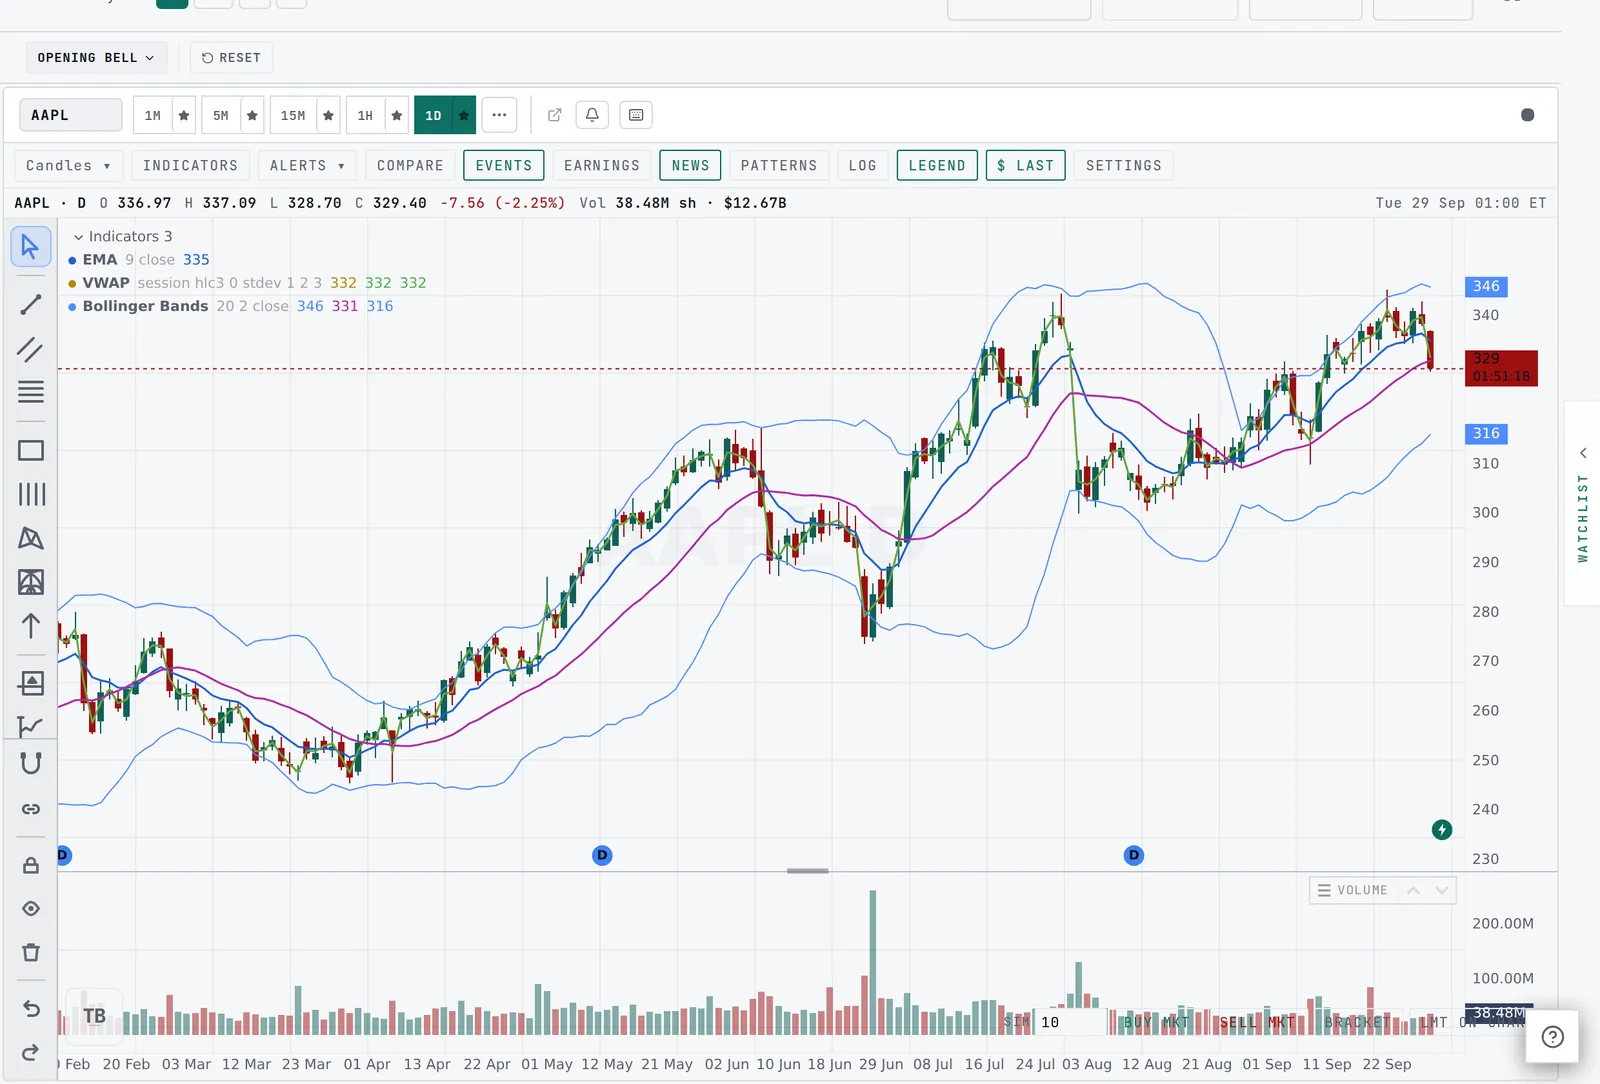
You can add the same indicator more than once, so a 9, 20 and 50 EMA each get their own length and color. Every indicator shows a tag on the price axis, so the value is readable without hunting for the line.
How to use it: press INDICATORS, search by name, add it, and use the gear in the legend to change length or color. Switch timeframe and you get the set you saved for that timeframe.
Try it on a chart → · Indicators in the guide
Alerts you set on the chart
The benefit: you draw the level where you see it, and Tapeboard watches it for you after you close the tab.
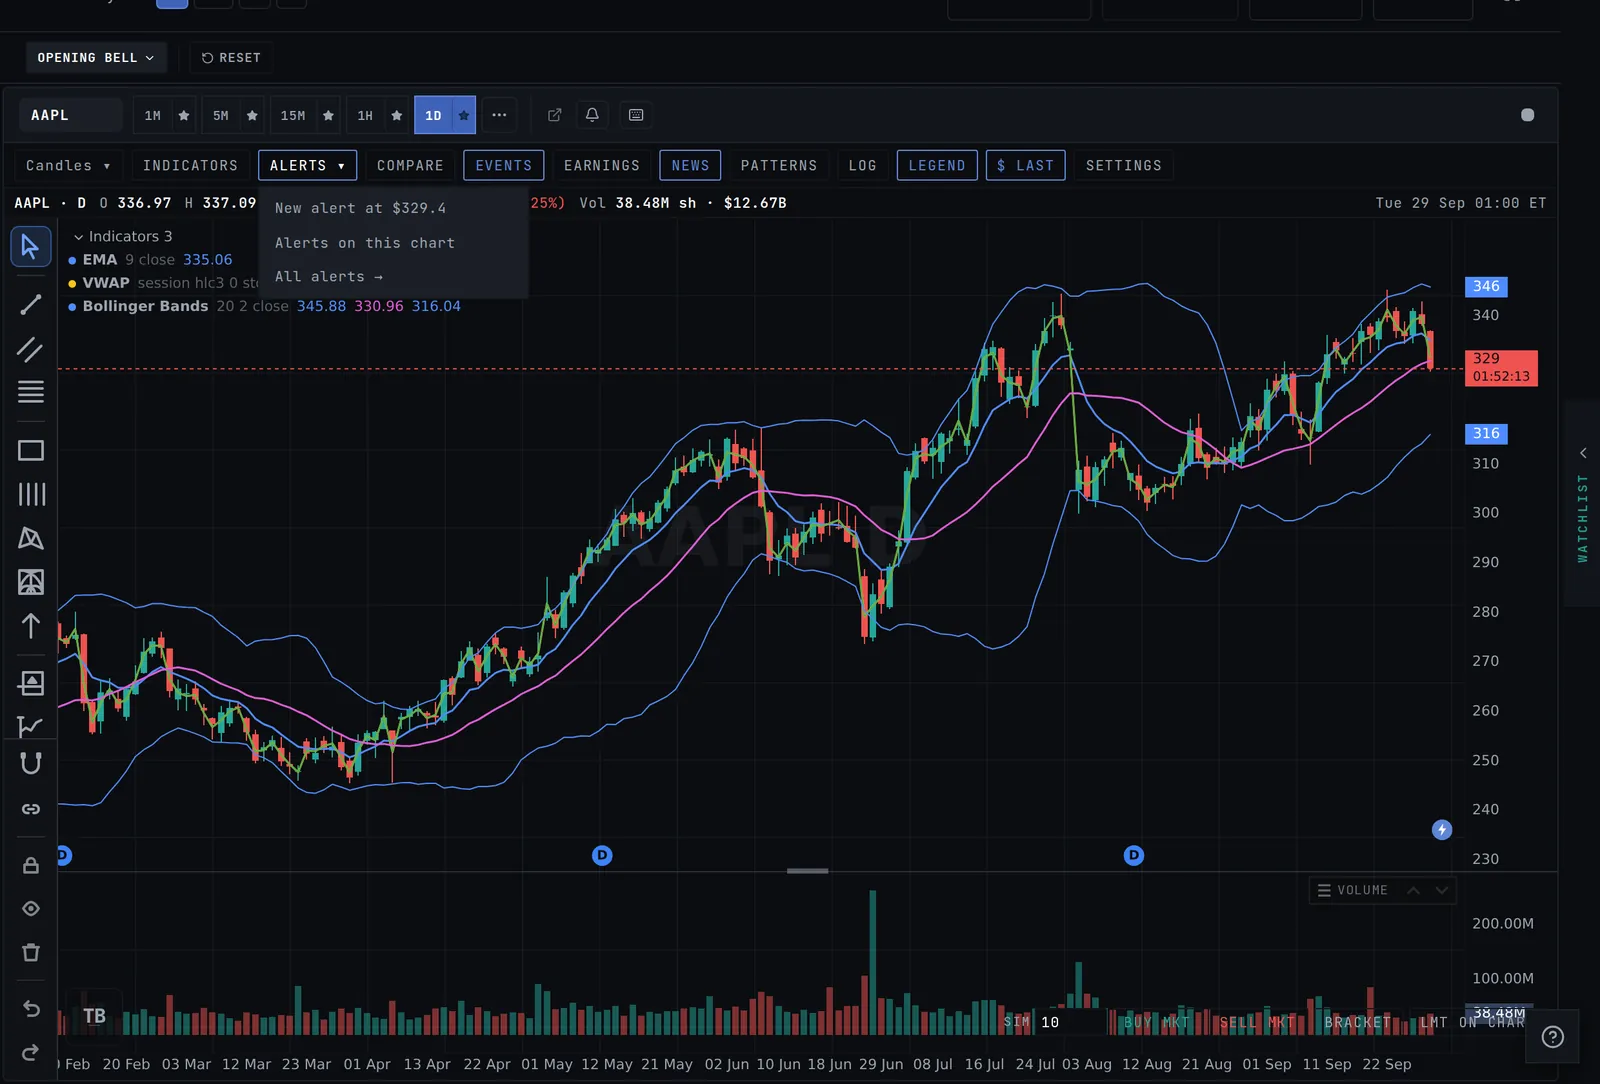
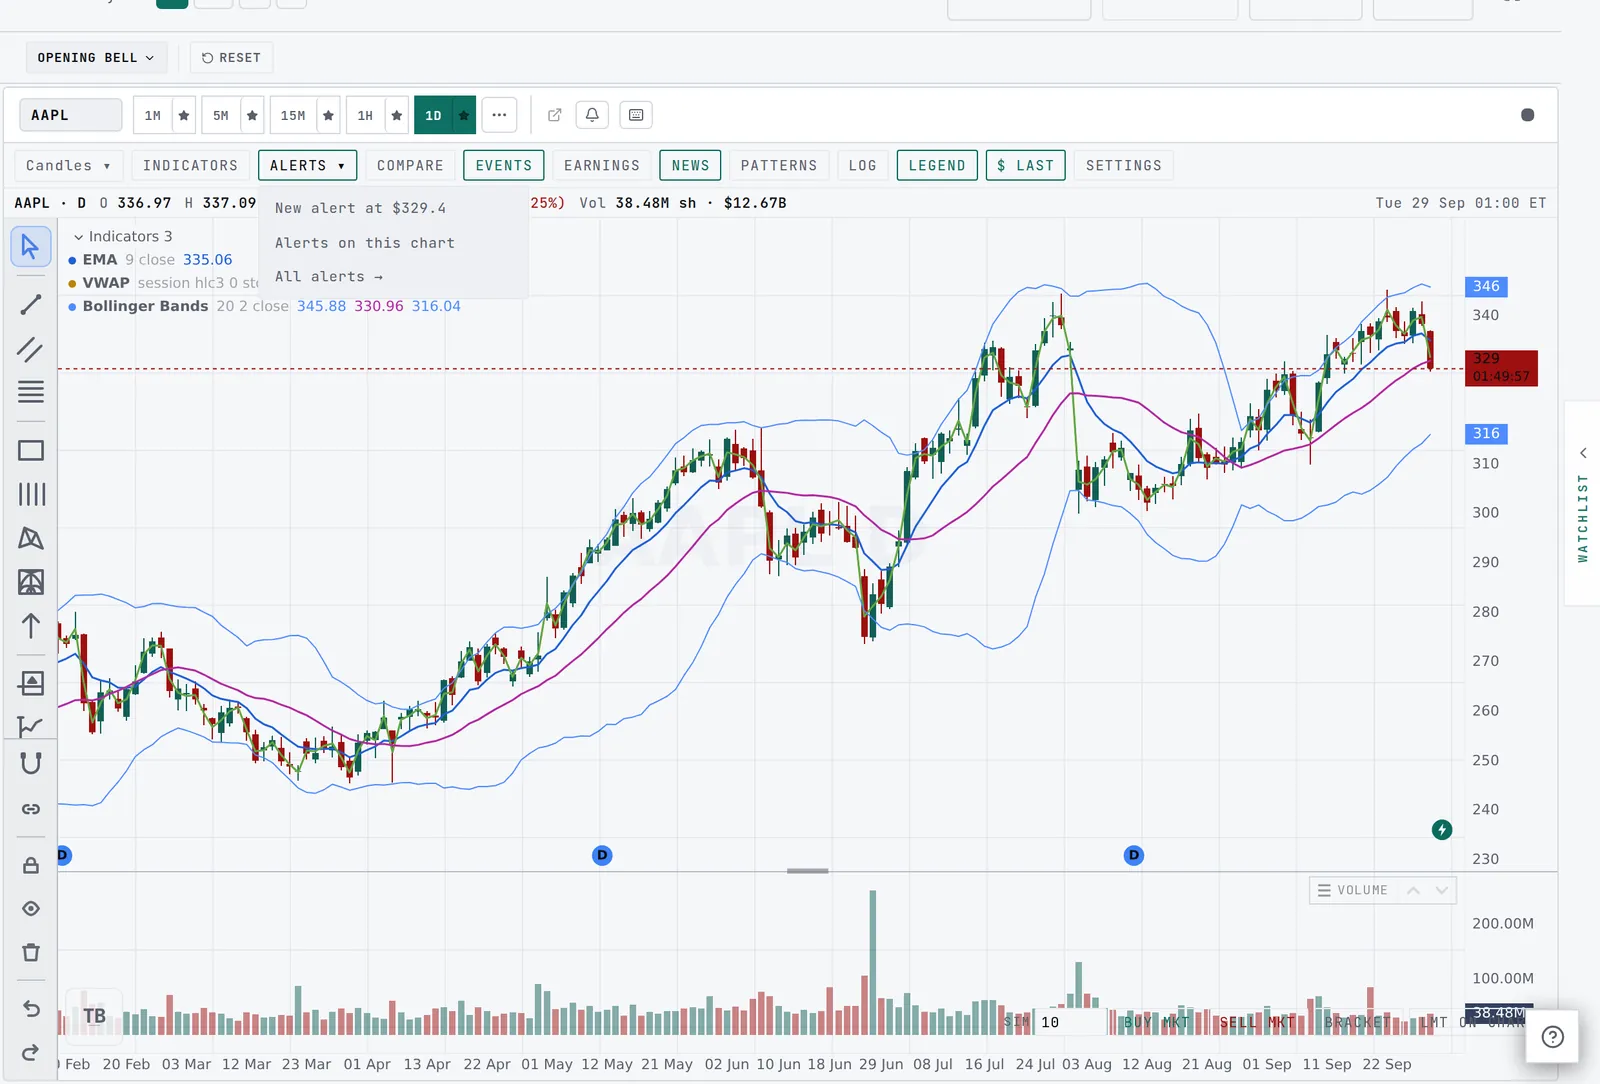
The ALERTS menu on the chart has three entries: a new alert at the current price, the alerts on this chart, and all alerts. An alert made on the chart is a real alert in your Alerts tab, so you can edit its cadence or delivery there. Alerts run on our side. They can reach you by push or email while the tab is closed, and the email carries a chart of the move.
How to use it: open ALERTS on any chart, pick New alert, then choose once, once a day, or every time in the Alerts tab.
Open your alerts → · Read the Alerts guide
Filings with Ask AI
The benefit: you know if a runner is about to dilute you before you click buy. Tap an OFFERING or SHELF tag and the filing opens inside Tapeboard with the key numbers on top: shares being issued, price when the filing states one, and how much the share count changed over 12 months.


Ask AI answers questions about that one document and quotes the line it used, so you can check it. The suggested questions cover the usual ones: how many new shares, at what price, who is the underwriter, how much could this dilute. The answer is a summary of public data and not advice.
How to use it: find a ticker with a dilution tag on the scanner, tap the tag, then tap a suggested question or type your own.
Open a filing → · Read the Filings guide
Scan in plain English
The benefit: you describe the setup and the scanner builds the filters. Type something like "small caps up over 10%" into the box at the top of the scanner and it turns the words into filter chips you can remove. Anything it could not turn into a filter is listed, so nothing is silently dropped. Pro.
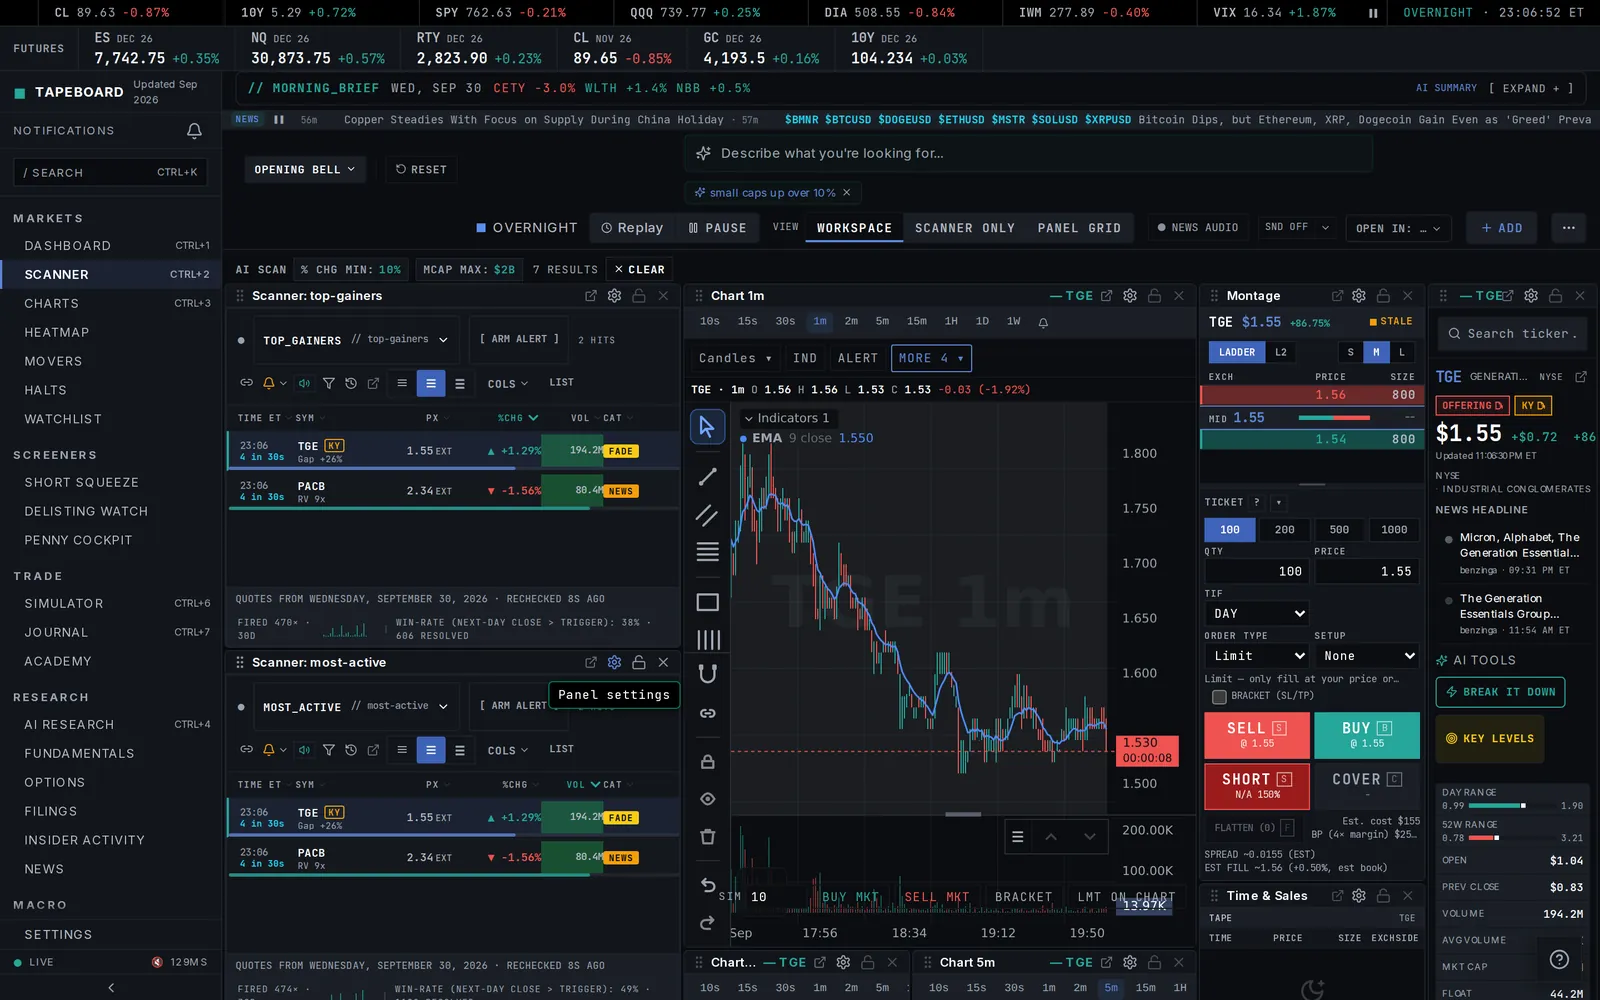
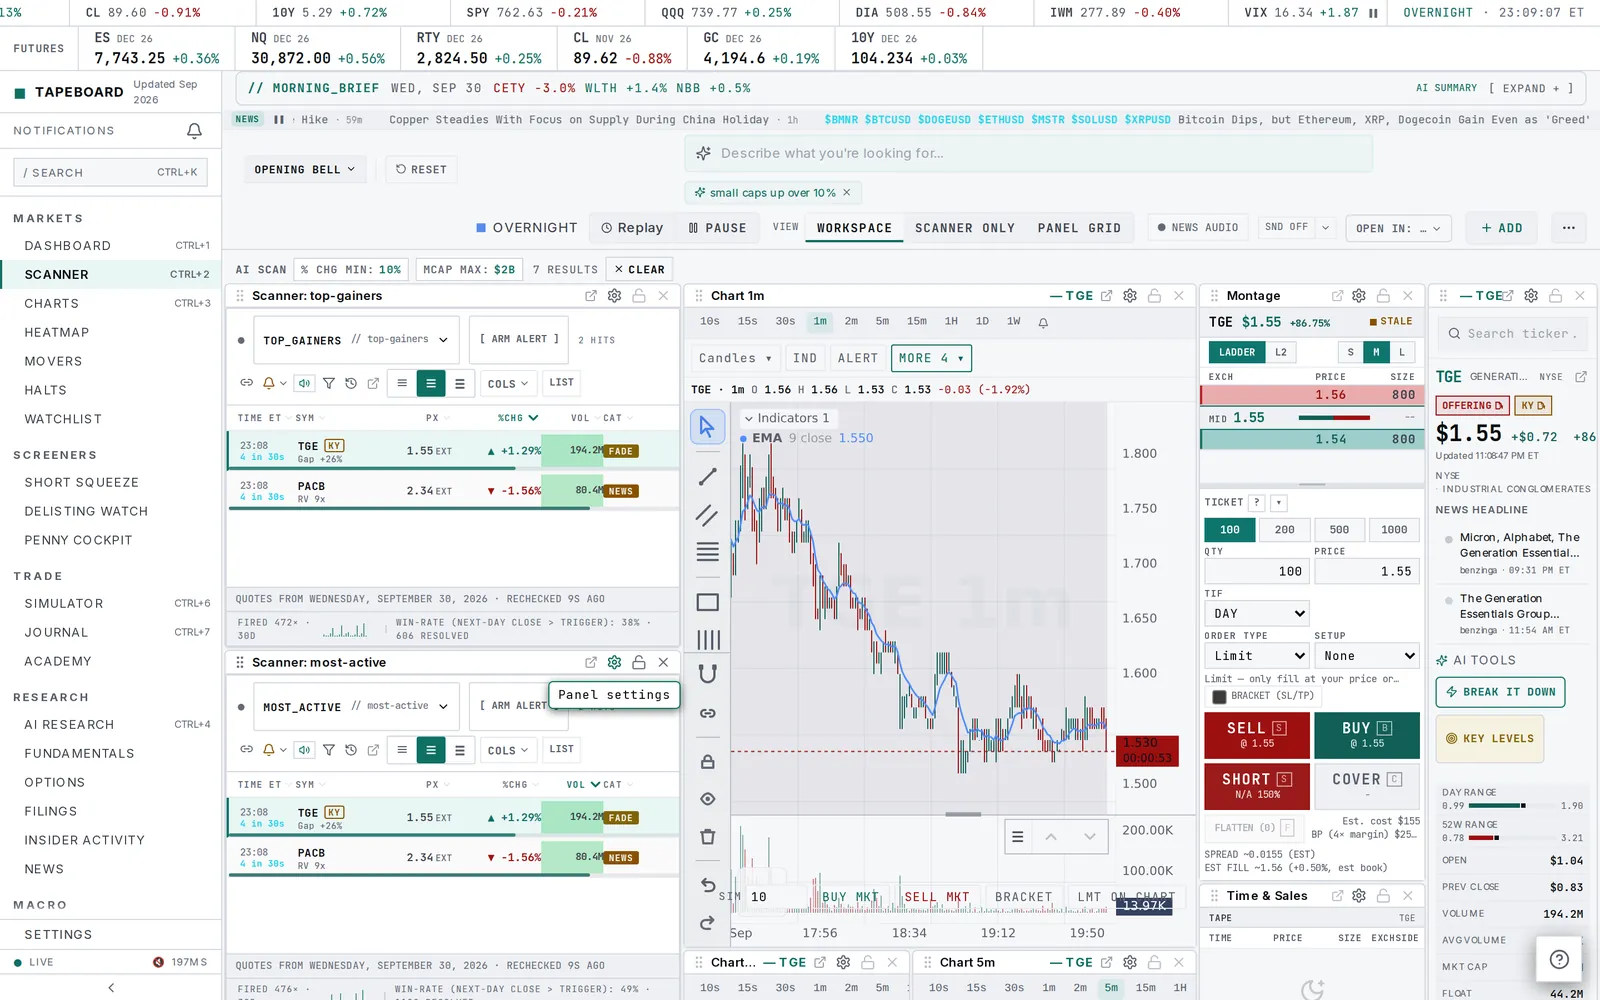
The strip above the scanner now shows live futures (ES, NQ, RTY, crude, gold and the 10-year), so you see the macro tape while you scan. The Montage panel was redrawn too. The Level 2 ladder and order ticket fit narrow panels without clipping.
How to use it: click the "Describe what you're looking for" box, type a sentence, press Enter, then remove or change any chip.
Try the AI scanner → · Read the Scanner guide
Futures, commodities and forex
The benefit: the macro desk is on the same screen as the stock desk. Commodities now shows real futures contracts (gold, silver, crude and more) with the front-month price, change against the prior settle, and the related ETF alongside. Forex quotes update in real time.
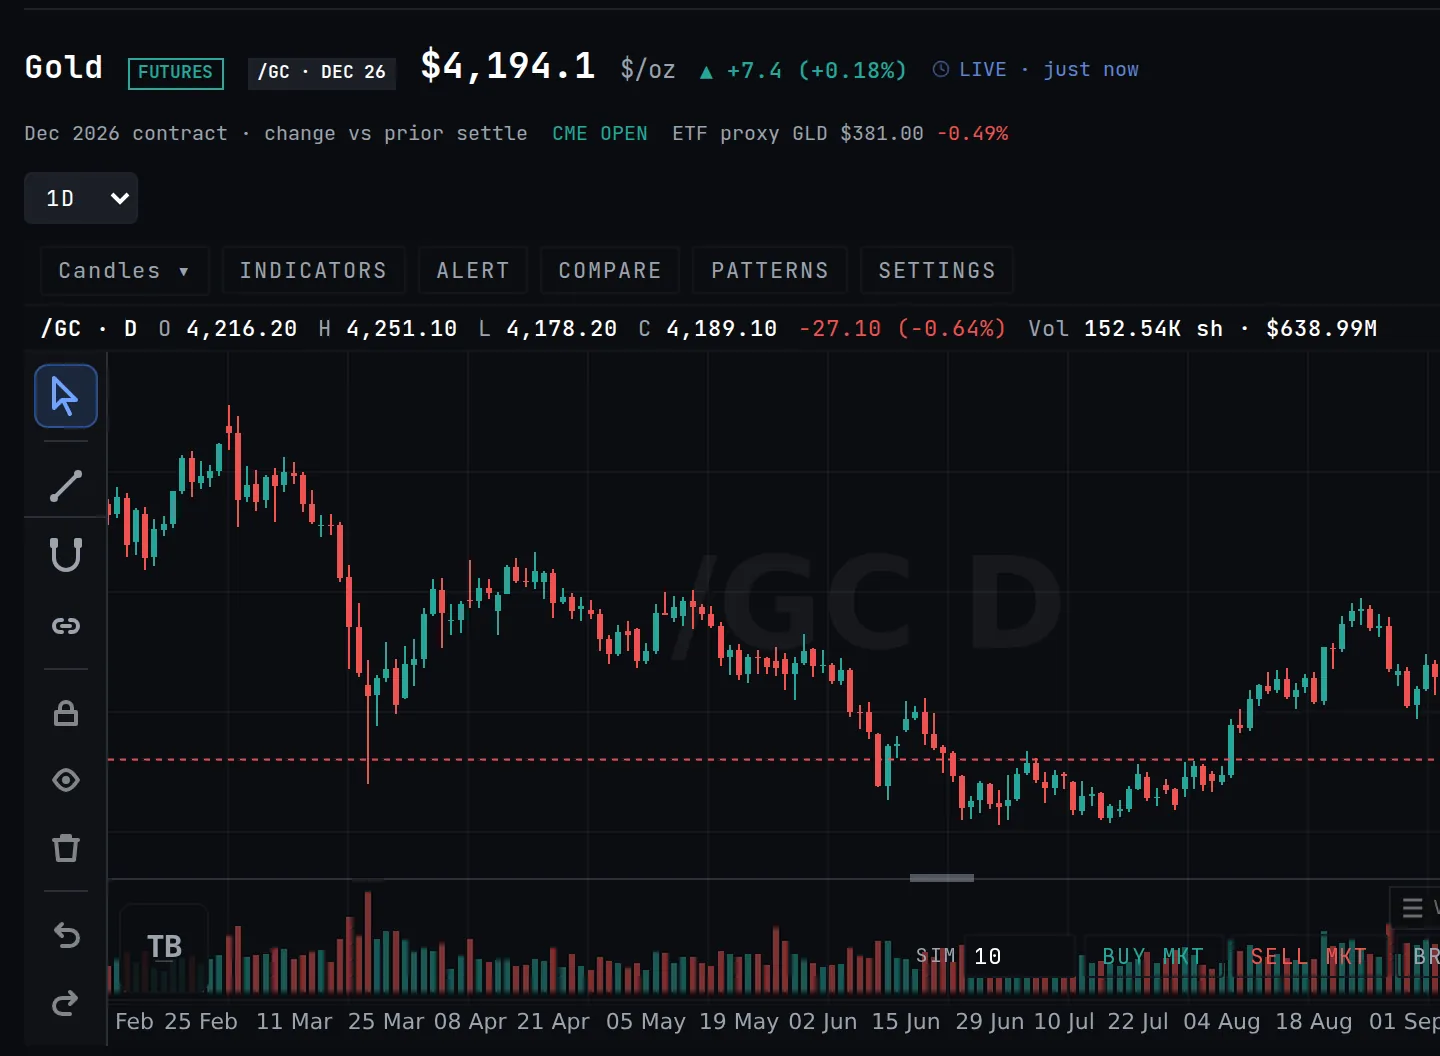
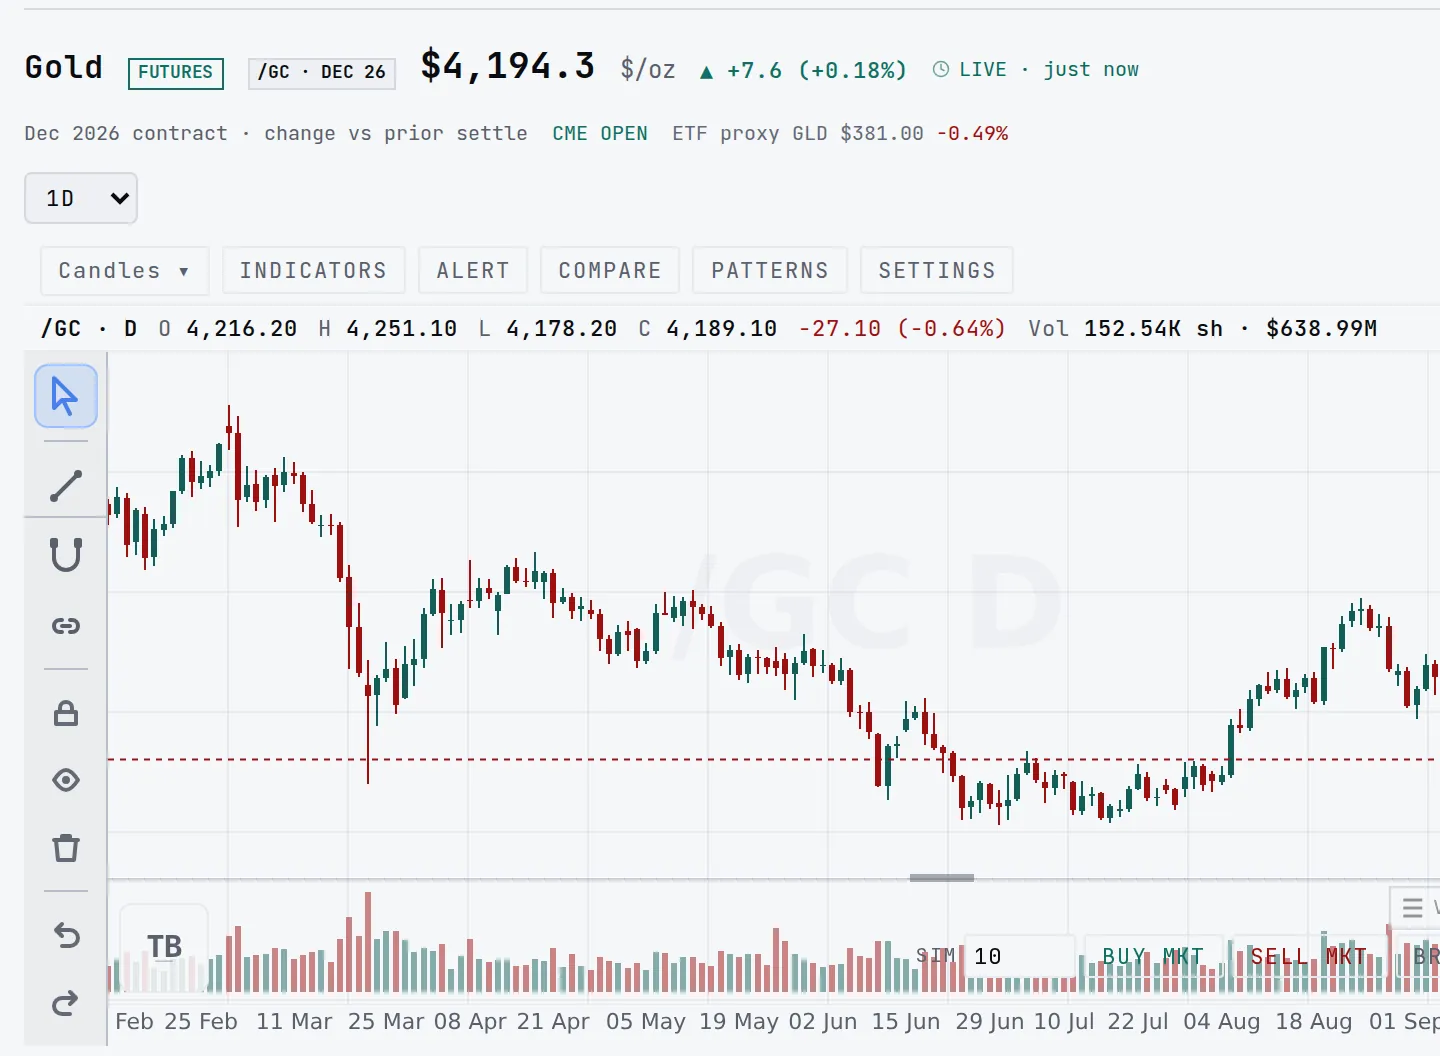
How to use it: open Commodities, pick a contract, and use the same toolbar as any other chart. On Forex, pick a pair to load its chart.
Open Commodities → · Open Forex → · Guides: Commodities, Forex
A notification bell that tells you more
The benefit: you can tell at a glance what fired and why you did or did not get a push. The bell now sits in the sidebar on desktop and opens the latest alerts, movers and digests in a list. Settings has push diagnostics, so if a push did not arrive you can see whether your device is subscribed, muted, or inside quiet hours.


How to use it: click the bell to read the latest items and use the trash icon to clear the list. To check delivery, open Settings and then Notifications.
Open notifications → · Read the Notifications guide
Also new this month
- Earnings, dividend and split markers on the chart, with a news bolt on bars where headlines landed.
- A pattern detector on every chart, behind the PATTERNS button.
- Drag chart panes to reorder them. The order is remembered.
- Grid layouts keep linked panes in sync by symbol and timeframe.
- Per-timeframe indicator sets that follow you across symbols.
- Dilution tags (offering, shelf, ATM, country) on scanner rows, the quote and the penny cockpit, each linked to its filing.
- Push alerts for price levels, halts and resumes on desktop and phone.
- The Level 2 ladder and order ticket redrawn for narrow panels.
- Short squeeze board rescored with calibrated odds and an In play list. See the Short Squeeze guide.
- Academy ranks from Rookie to Daily Desk, with badges you can share. Open the Academy.
The simulator still uses the earlier chart.
Start with the scanner
Every piece above is one click from the scanner. Open the scanner to try the plain-English search, or start free if you do not have an account yet. If something is missing, reply to any Tapeboard email. It reaches me and I read every reply.
Marcus, customer success at Tapeboard